More D3 Joins: Enter, Update, and Exit
Getting Started
In the previous lesson on the basics of D3 data joins, we introduced the code below which creates a bar chart to represent thenum data array.
// The data array

                            let nums = [1, 2, 3, 4, 5, 6];


                            // This will create an empty selection since we have no rectangles yet!

                            let existing_rects = d3.select("svg").selectAll("rect");


                            // Perform the data join

                            let data_join_result = existing_rects.data(nums);


                            // Join the unmatched data items to new rectangles.

                            data_join_result.join("rect")

                                .style("fill", "black")

                                .attr('x', (d,i) => i*55)

                                .attr('y', d => 300 - d*20)

                                .attr("height", d => d*20)

                                .attr("width", 50);
- 1. Get an array of data to visualize (in this case, the variable
num). - 2. Select the existing rectangles (initially an empty selection since we haven't created any rectangles yet).
- 3. Perform the data join to connect the data array to the selection of rectangles.
- 4. Add rectangles for the new items found in the data join.
Scroll through the rest of this page to see data joins work when data is dynamic.
Dynamic Data
Generally speaking, we can think of any update of a visualization (either the initial drawing of the shapes, or updates of the shapes to reflect a change in data) using a very similar workflow as in the basic data join. In fact, the first three steps are exactly the same!- 1. Get an array of data to visualize (in this case, the variable
num. - 2. Select the existing rectangles (initially an empty selection, since the visualization has no rectangles at first, since we haven't created them yet).
- 3. Perform the data join to connect the data array to the selection of rectangles.
// The data array

                            let votes = [{color: "red", votes: 1},

                                {color: "blue", votes: 2},

                                {color: "green", votes: 3},

                                {color: "purple", votes: 4},

                                {color: "silver", votes: 5},

                                {color: "pink", votes: 6}];
An Updated Visualization: Color-Coded Bars
Updating our code for creating the visualization slightly, we can now create a color-coded bar chart.// This will create an empty selection since we have no rectangles yet!
let existing_rects = d3.select("svg").selectAll("rect");
// Perform the data join
let data_join_result = existing_rects.data(votes);
// Join the unmatched data items to new rectangles.
data_join_result.join("rect")
.style("fill", d => d.color)
.attr('x', (d,i) => i*55)
.attr('y', d => 300 - d.votes*20)
.attr("height", d => d.votes*20)
.attr("width", 50);
A New Vote → New Data!
Now let's imagine that we ask a brand new class of students about their favorite colors and gather the following results.// The data array
let votes = [{color: "red", votes: 4},
{color: "blue", votes: 3},
{color: "black", votes: 2},
{color: "orange", votes: 4}];
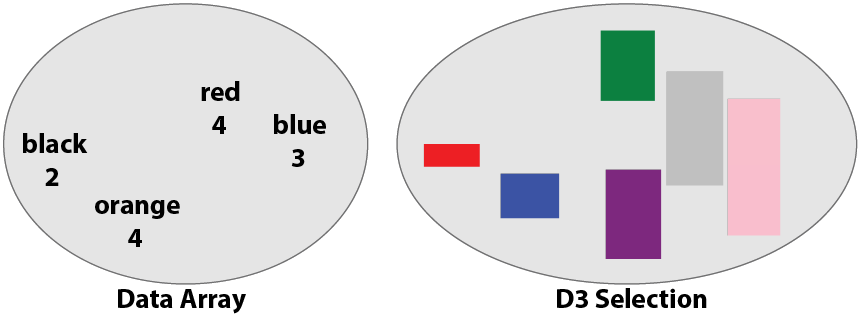
The First Step: Data and D3 Selection
The data join process begins by identifying two data structures: (1) the data array that you wish to visualize, and (2) a selection of graphical objects that represent the corresponding data in the existing visualization.// The data array
let votes = [{color: "red", votes: 4},
{color: "blue", votes: 3},
{color: "black", votes: 2},
{color: "orange", votes: 4}];
// Select the existing bar chart rectangles. We have six existing rectangles!
let existing_rects = d3.select("svg").selectAll("rect");
votes data array with our new voting data, and (2)
the value of the existing_rects variable which contains a D3 selection of all of the
rectangles that currently exist in our existing bar chart prior to our update for the new data.
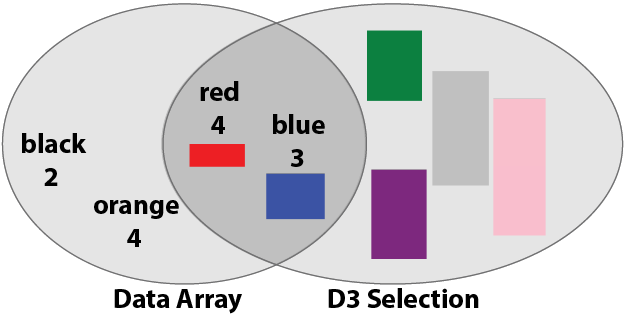
The Second Step: Data Join to Determine the Enter, Update, and Exit Selections
Next, we D3 to perform a data join using the .data(...) method. This connects the data array to the D3 selection of graphical objects.// Perform the data join
let data_join_result = existing_rects.data(votes, d => d.colors);
d=>d.colors? It's a key function that tells D3 to use the color
attribute to find corresponding data elements and graphic objects. It identifies the "unique ID" for each data element in our array.
The data join process creates three distinct
sub-selections as a result:
- 1. The enter selection, containing new data items for which new graphical objects must be added to the visualization. These are data points that should be entering the visualization.
- 2. The exit selection, containing old graphical objects for which data no longer exits in the data array. These are graphical objects that should be exiting the visualization.
- 3. The update selection, containing existing graphical objects for which there is also a corresponding data object. These are graphical objects that should remain in the visualization, but be updated to reflect any changes in data.
The Final Step: Updating the Visualization
As the final step in updating our visualization, we must specify what to do for the three enter, exit, and update selections. This is done using the same .join(...) method we used in the basic example, but with more specific instructions. for the .join(...) method in D3 is apply the specified code to the enter selection.// Update the visualization.
data_join_result.join(
enter => enter.append("rect")
.style("fill", d => d.color)
.attr('x', (d,i) => i*55)
.attr('y', d => 300 - d.votes*20)
.attr("height", d => d.votes*20)
.attr("width", 50),
update => update
.style("fill", d => d.color)
.attr('y', d => 300 - d.votes*20)
.attr("height", d => d.votes*20),
exit => exit
.remove()
);
Putting it All Together
Here are all the steps put together into a single script.// The data array
let votes = [{color: "red", votes: 4},
{color: "blue", votes: 3},
{color: "black", votes: 2},
{color: "orange", votes: 4}];
// Select the existing bar chart rectangles. We have six existing rectangles!
let existing_rects = d3.select("svg").selectAll("rect");
// Perform the data join
let data_join_result = existing_rects.data(votes, d=>d.color);
// Update the visualization.

                            data_join_result.join(

                                enter => enter.append("rect")

                                    .style("fill", d => d.color)

                                    .attr('x', (d,i) => i*55)

                                    .attr('y', d => 300 - d.votes*20)

                                    .attr("height", d => d.votes*20)

                                    .attr("width", 50),

                                update => update

                                    .style("fill", d => d.color)

                                    .attr('y', d => 300 - d.votes*20)

                                    .attr("height", d => d.votes*20),

                                exit => exit

                                    .remove()

                            );